Local governments are facing a range of challenges, even though the broader State economy is much improved over a few years ago.
Local Governments Rely Heavily on Real Property Taxes as a Major Source of Revenue
- Real property taxes are the single largest source of local government revenue in the State, making up 44 percent of the total.
- Some governments are even more dependent on the property tax for their revenues, including school districts (57 percent), towns (54 percent) and villages (48 percent).
- Sales taxes are also an important but volatile revenue source (13 percent of total revenue), with strong growth in good economic times and declines in recessions. Recently, sales tax growth declined from about 5 percent a year (2011 through 2013) to around 3 percent a year (2014 and 2015).
- Other sources of revenue include:
- State aid (23 percent);
- charges for services (7 percent);
- federal aid (6 percent); and
- other local taxes and revenues (7 percent).
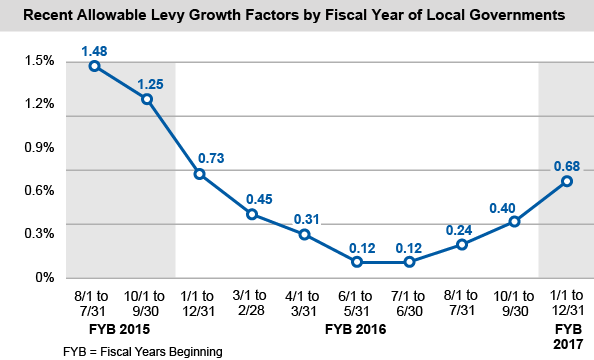
Property Tax Cap Shrinks to Nearly Zero for School Districts
The real property tax levy limit (commonly called the “tax cap”), enacted in 2011, was intended to help address the impact of real property tax increases. The law generally limits levy growth to the lesser of 2 percent or the rate of inflation, with some exceptions. The formula includes a number of other components that can also affect the limit—sometimes by a large amount.
- For villages with fiscal years ending May 31, 2017 and school districts with fiscal years ending June 30, 2017, the allowable levy growth factor declined sharply from the previous year to 0.12 percent—the lowest since the tax cap law was enacted.
- For local governments with fiscal years ending December 31, 2017, the factor declined slightly from the previous year, from 0.73 percent to 0.68 percent, remaining well below 2 percent.
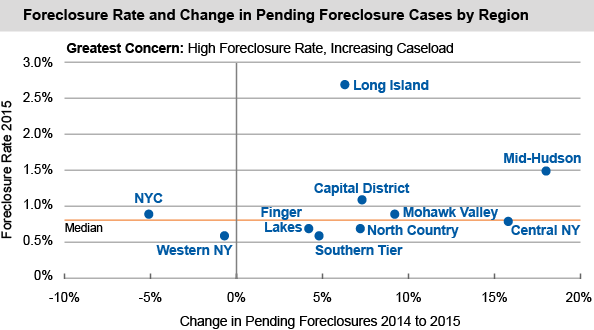
Foreclosures Still Pose a Challenge for Local Governments
Nearly a decade after the collapse of the housing bubble, foreclosure activity remains high in many regions of the State. This trend affects not just the individual homeowners, but also neighborhoods and local governments. Owners sometimes abandon their properties before the lengthy foreclosure process is complete, leaving vacant “zombie properties” that slowly decay, contributing to blight, reducing property values and eroding local government tax bases.
- State foreclosure filings for 2014 totaled 43,868, well above pre-recession levels.
- At the beginning of 2015, the pending statewide foreclosure caseload stood at 92,070.
- The corresponding foreclosure rate (the number of pending foreclosure cases as a percentage of housing units) was 1.13 percent, or 1 in 88 housing units.
- Long Island had the highest regional rate at 2.7 percent, and a growing caseload.
- The Mid-Hudson region had the highest growth in pending cases from 2014 to 2015 at 18 percent.
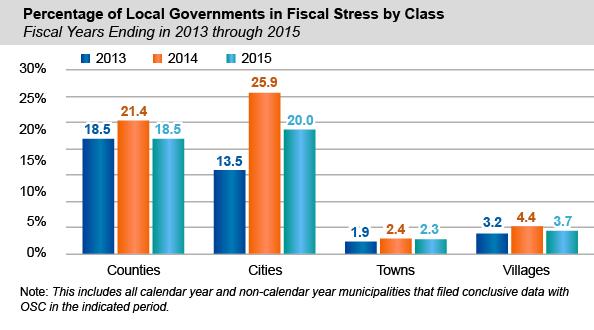
Fiscal Stress Varies Across Local Governments and School Districts
The Office of the State Comptroller analyzes the financial condition of each municipality and school district through its Fiscal Stress Monitoring System, which combines a number of financial indicators into an overall score intended to measure entities’ budgetary solvency. Three full fiscal years of scores have now been released for cities, counties, towns, villages and school districts in the State.
- Over the three years, only 7 percent of local governments and 23 percent of school districts have shown signs of fiscal stress for at least one year. The incidence of stress varies by type of local government.
- Counties and cities are much more likely than towns and villages to be experiencing some level of fiscal stress. For the fiscal year ending (FYE) in 2015, 10 of 57 counties and 11 of 61 cities across the State were rated to be in fiscal stress.
- In contrast, only 18 of 548 villages and 20 of 932 towns were in a fiscal stress category in FYE 2015.
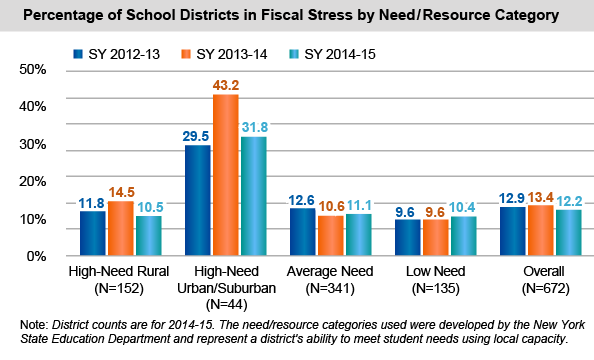
- For each of the last three years, between 12 and 13 percent of school districts overall have shown signs of fiscal stress.
- High-need urban/suburban school districts are much more likely than districts overall to experience fiscal stress (31.8 percent compared to 12.2 percent for the 2014-15 school year).
- A small number of entities are experiencing ongoing, chronic fiscal stress: 19 of 1,598 local governments and 32 of 672 school districts have been identified as being in some level of fiscal stress for three years in a row.